Automating Repetitive Excel Work - A Case Study with Finance and Accounting
Does your team spend precious time making the same Excel report every quarter, month, or week? There's another way.
Collin Tsui
7/16/20252 min read
Many finance and accounting teams run on Excel. It’s a powerful, flexible tool. But for complex, repetitive tasks, its manual nature can become a significant drain on time and a source of potential errors. This is the story of how one company reclaimed three days of work every month by rethinking its process.
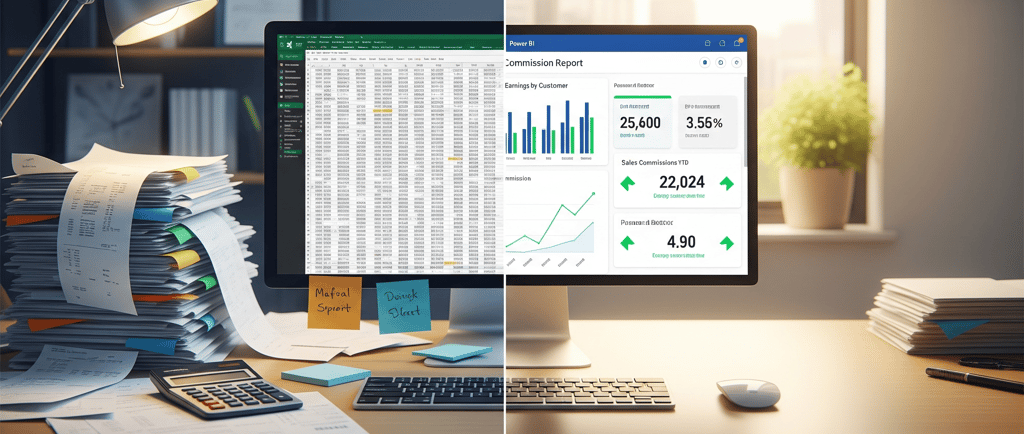
The Scenario: The Monthly Commission Grind
An accounting team at a construction equipment distributor was responsible for calculating monthly sales commissions. The process was a familiar one:
Download multiple data exports from their accounting system.
Open a complex Excel workbook filled with VLOOKUPs and nested IF statements.
Manually combine the new data and apply the company's business logic to calculate commissions.
Split the results into separate spreadsheets for each person (for privacy / confidentiality), then email each one out separately.
The logic was complicated, with tiered rates for sales discounts, a different set of tiered rates for rentals, manager matches, splits for team sales, and one-of rates for specific clients and POs. The entire process took about three days each month and was a task the team dreaded.
The Solution: A Shift to Power BI
Instead of trying to build a better spreadsheet, I proposed moving the entire workflow into Power BI.
The goal was not just to automate, but to create a transparent, trustworthy system. In the same three days the team would have spent on one manual calculation cycle, I built a first draft of the Power BI report, replicating all their existing business logic. I even kept the business rules on an Excel file in SharePoint, so the accounting team doesn’t need to call me for routine updates.
The Power BI report is secured so each salesperson sees only their own commission data, while managers can view their entire team. This eliminated the hassle of individual reports for every salesperson, and eliminated the possibility of sending compensation data to the wrong person through clerical error.
The Key Differentiator: Building Trust Through Transparency
A "black box" automation isn't helpful if the team can't verify the results. The Power BI report showed the final commission for each purchase order, but also “showed the work” (my high school math teacher would be proud!). Any accountant or salesperson could see and check exactly how the commission was calculated —the base amount, the discount applied, the commission rate, and any matches or splits. This transparency was critical for building trust. After a few hours of tweaks based on feedback, the report was ready for testing.
The Impact: From Monthly Chore to Strategic Tool
The team ran the old Excel process and the new Power BI report in parallel for one cycle. The numbers matched perfectly. They quickly abandoned the spreadsheet for calculating commissions and now only export a final, signed copy for record-keeping.
The results:
Time Saved: A three-day manual process became an on-demand report.
Accuracy: Automation eliminated the risk of copy-paste or formula errors.
Confidentiality: Secure access ensured compensation data is only seen by the right individuals.
When the COO saw this, he got very excited, but for a completely different reason. I'll have more on that next week.
Ready to recover your team’s valuable time?
If this story of a time-consuming Excel task sounds familiar, it may be time to evaluate how Power BI can free up your team’s most valuable resource: their time. Want to make this a reality for your team? Let’s talk!
I build custom Power BI solutions that provide the efficiency needed to keep projects on time and on budget. Contact me today to see how you can unleash your data.